Intro: Debugging integration tests
Integration tests are very crucial to detect if our components still work as expected. But when they start failing then debugging integration test failures, especially in distributed systems, often presents significant challenges.
Normally a test runner like jenkins will generate a static report formatted with JUNIT XML, Nunit etc which require a separate processing system to visualize into an html.
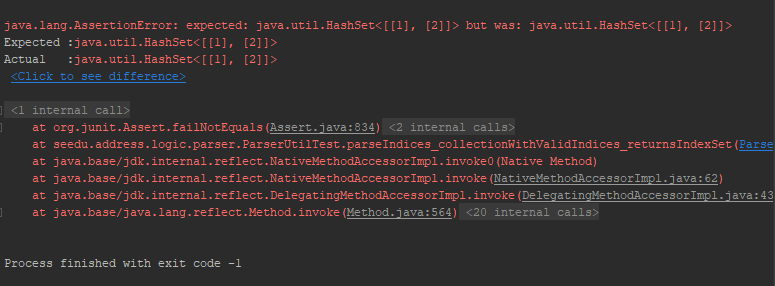
When a test fails, the report provides a limited context. Since it will log which assertion failed and it is up to you to go and check the logging why it failed.
Consider the following scenario: an integration test makes an API call, and the service returns a 500 internal error.
Bobby: 500 error! thats internal server, Lets check the logs of the service!
Good idea, let me have a look, the service did another call to another service which failed.
Bobby: I’ll have a look se we checked the logging of these 3 applications but i have trouble finding the exact issue in the logs.
Yes Bobby i also have trouble finding the right log message, there are too many interactions with the server and i have a hard time knowing which log messages are related to our 500 error api call.
Opentelemetry comes and saves the day
OpenTelemetry (OTEL) is an open standard for generating telemetry data — including traces, metrics, and logs. While initial setup can be a bit involved, its vendor-neutral design and growing community adoption make it a powerful choice for modern observability.
On our environment we use the typical grafana stack:
- Alloy to collect the telemetry data
- Tempo to store the traces
- Prometheus for metrics
- Loki for logs
- Grafana for the dashboards
With OTEL we can setup distributed tracing. A trace collects all the information related to a request through the whole system, the traces is composed of a series of spans. Each span gives information about a specific part of the request.
A span also has a status, which can be Ok, Unset or Error, and ‘context information’ which is standardized across applications and languages.
When setting up Otel the logs of our application, logfmt in this case, will contain these trace_id and span_id.
| |
When our test makes a request to the application it will pass the trace_id in the http headers. So the other application can then continue the trace and mark its logging with the same trace ID. This allows us to easily fetch all the logging from all applications created from our request.
This allows us to easily to correlate the logs and the trace, Now how do the traces look like you may ask?
The data would look like this:
| |
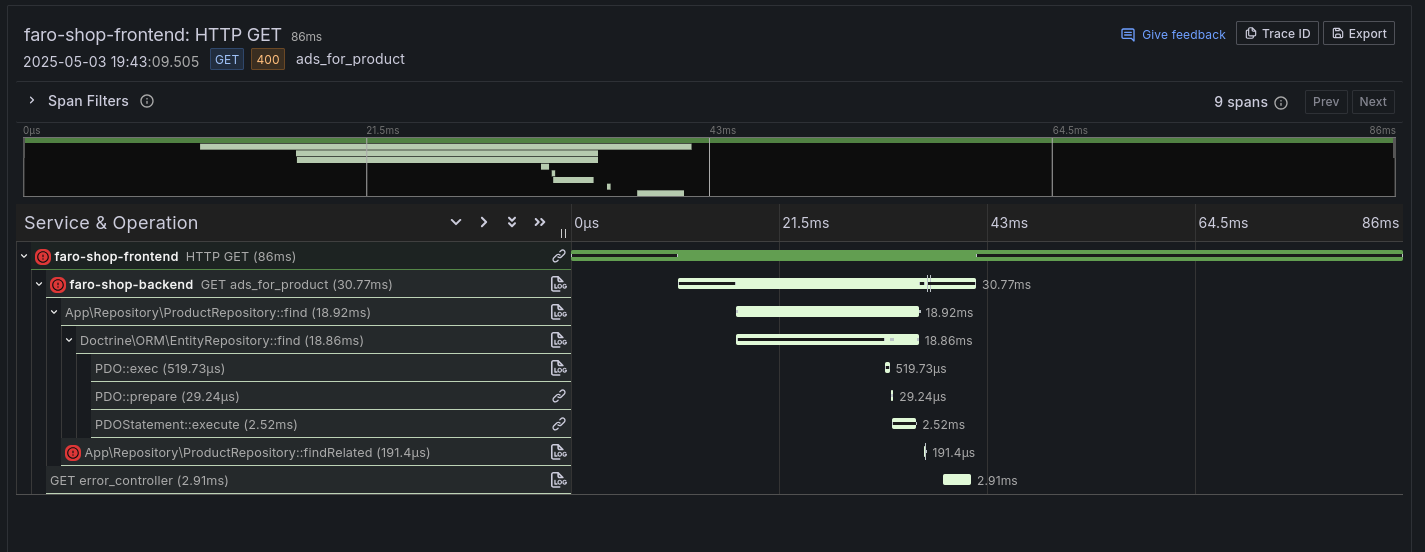
In the tempo ui a trace would look like this here you can see that the call to ‘findRelated’ failed.
Integration Tests as Spans
For every testSuite we can create a trace where each test is a span where we map the statuses of the test to otel statuses like Pass -> Ok, Fail -> Error and Skip -> Unset.
To make these spans more useful we can add our own metadata as attributes to the span:
test.suitethe Test file or Class in java or a top level test method in golang.test.ida short id of the test this can be the method or manually typed this will be used in a metric.test.description: A description of wat the test is trying to verify this is only added to the spantest.status: a custom attribute to tag the status of the test
An simple example on how to do it in code in a real example:
| |
When actually making test with this its best to wrap the span part into a test helper handling the span.
Processing the spans to metrics
To create a better dashboard we want to generate a metric from the test results. The Otel collector/Alloy allows you to process spans into metric: So in short the alloy config has multiple blocks with inputs, ‘receivers’ these can go trough ‘processors’ and are then forwarded to the right tool using an ’exporter’.
| |
What the above config does is create a metric called with the structure ’test_calls_total{test_suite, test_id, test_status}’ where each status test with status gets a counter.
Now since we setup the above we do not need to process any test artifact. We get traces from any span with a ’test.suite / test.id’ and they will be automatically be picked up by our observability stack.
Bobby Wait, so the Otel collector/Alloy processes these spans anyway, Could we use this to push the logs from test environments outside of the cluster? like a developers machine or an external network?
Yes that would be possible this can be very useful for:
- Debugging test locally while still having the trace across multiple systems
- Running end to end tests from an external network (simulating user access) and capture telemetry from the entry point all the way to through the system. Allowing us to see if the VPN and Loadbalancer are configured as expected.
The possibilities for integrating various test scenarios and sanity checks are vast.
Visualization
Since we now have all the information needed we can create a dashboard.
So we can use the following metrics.
For successful tests: increase(test_calls_total{test_status="ok"}[1h]) > 0 and increase(test_calls_total{test_status="failure"}[1h]) = 0
For failing tests: increase(test_calls_total{test_status="failure"}[1h]) > 0 and increase(test_calls_total{test_status="ok"}[1h]) = 0
For flaky tests: increase(test_calls_total{test_status="failure"}[1h]) > 0 and increase(test_calls_total{test_status="ok"}[1h]) > 0
These we can combine into a single stats dashboard to mark failing tests in red, flaky tests in orange and successful tests in green.
When clicking the stat we can limit a trace query to the specific failing test suite to show a list of most recent failures. Then when we click the actual trace we can open a new tab and show the trace and all the logs related to it. As a result we don’t have to search each individual service its logs but we can naturally drill down until we find the issue.
So now we don’t have a Junit test report with only the test failure assertion but we get the full range of metrics all the way down to the specific logs of the event. It might even be possible to drill down one level deeper by providing links to the dashboard of each specific service so you can also see the service its load at the time period of the test.
Results
By leveraging your existing OTEL stack for integration tests, you gain several key advantages:
- A unified real-time view of test outcomes within your existing Grafana observability stack.
- The ability to set alerts, trigger rollbacks, or drill down directly from failing test to its associated logs and traces.
- Simplified tooling, replacing an alternative test system which handles Junit XMLs.
A free self check of your observability stack, Since essentially you will find blind spots in your observability tack of services that are not instrumented yet. But now you automatically see where these gaps are.
The traces can also help with finding performance issues in existing tests since they contain the duration of each span.
The disadvantages: It takes quite some effort to update existing applications to include otel metrics to enable distributed traces and logs.
- Setting up Otel on golang projects is not easy and might need Manual instrumentation, Auto instrumentation using EBPF, or Alternative Compilation.
- For java there is the Otel Java Agent, which is easier to setup.
- For python its rather easy to setup.
Future Ideas
- Share a repo with code examples for different languages
- The same idea could be used to generate opentelemetry data for Github actions and push this to a grafana instance to show information about builds and tests.
- Using opentelemetry in the CI/CD pipeline this would allow us to also track integration tests, failing builds and even add attributes to our test spans which include the git hash. Then we can trace back a failing test to a certain version change in our code.